
The Architecture of a Production LLM Inference Platform
Production LLM inference as control and data planes: intake, routing, compute scheduling, response delivery, and observability — a platform mental model.
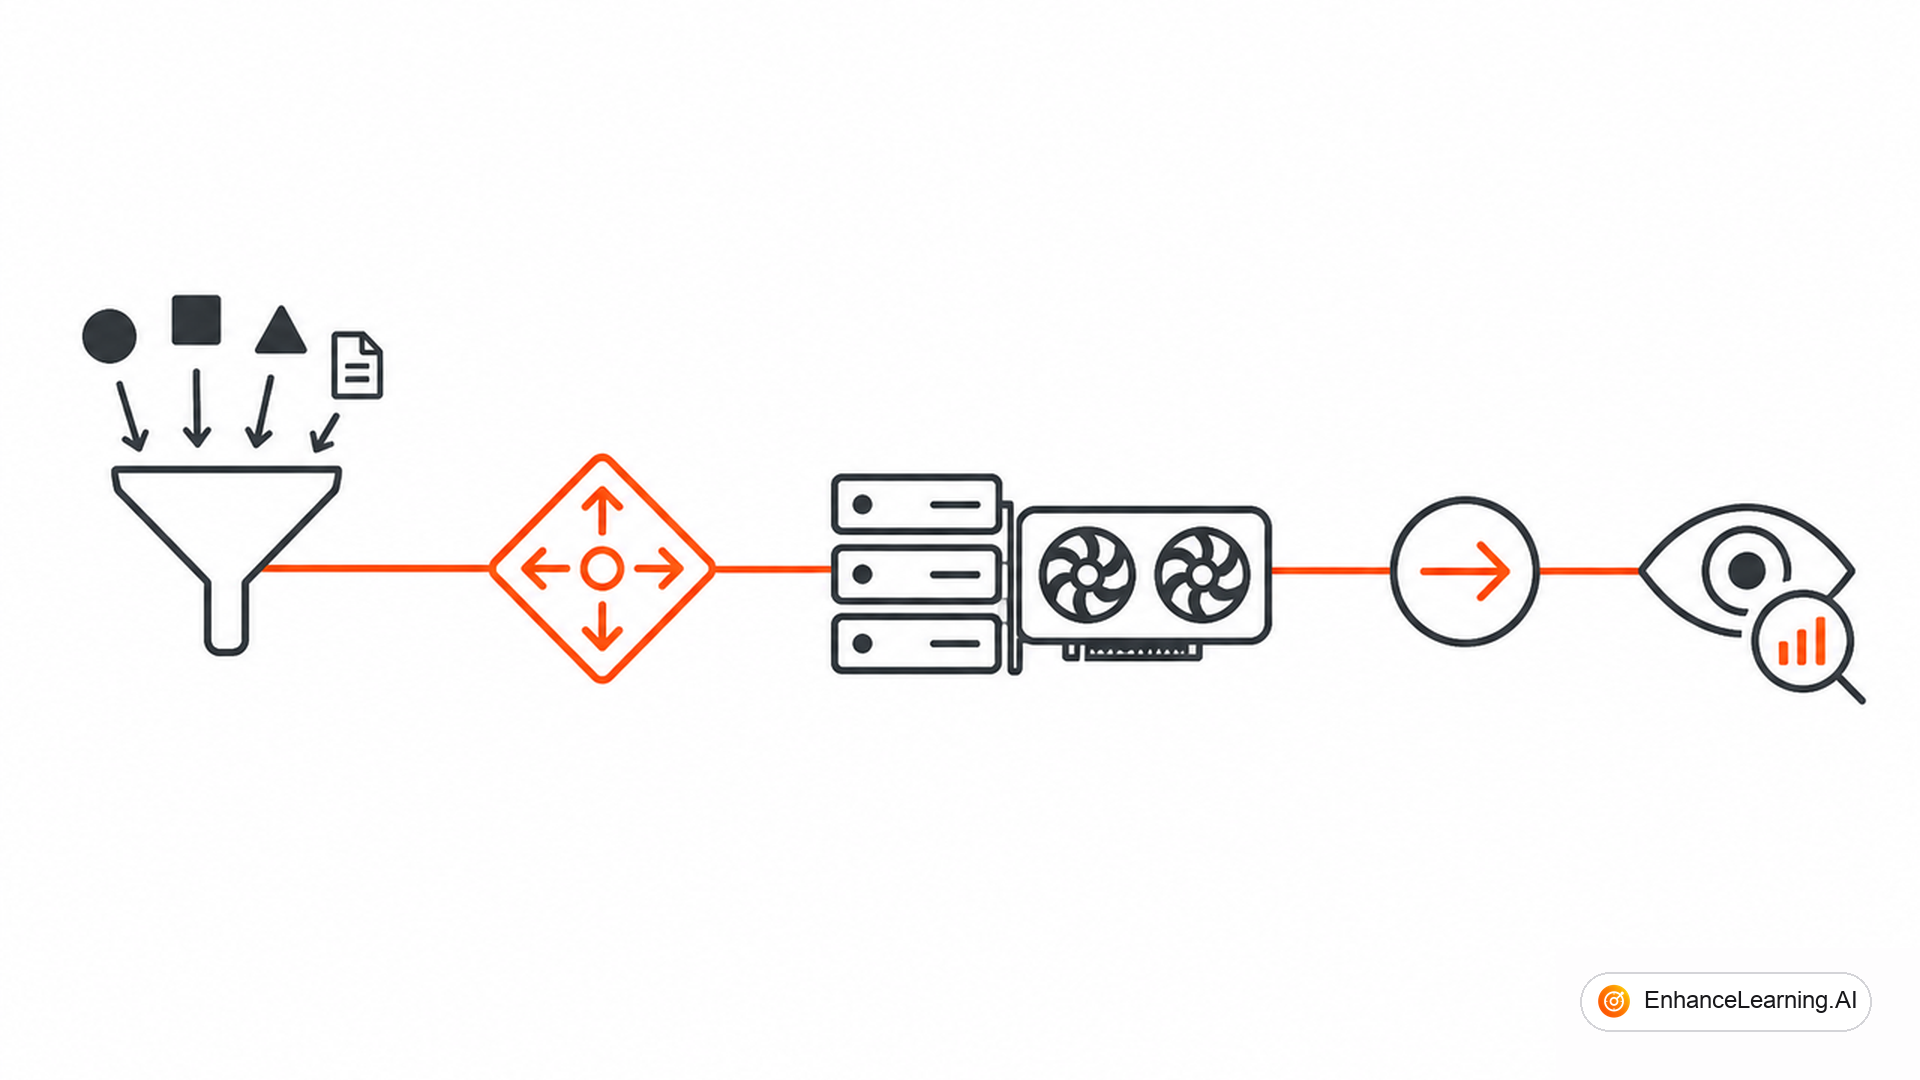
Building a production LLM inference platform is not the same as calling an API from application code. It is designing a system that accepts heterogeneous requests, routes them to the right compute under policy constraints, delivers responses reliably, and produces enough telemetry to operate at scale. This article describes that platform as a control plane and data plane — the mental model platform engineers use when the gateway-and-cache map is no longer enough.
Control plane vs data plane#
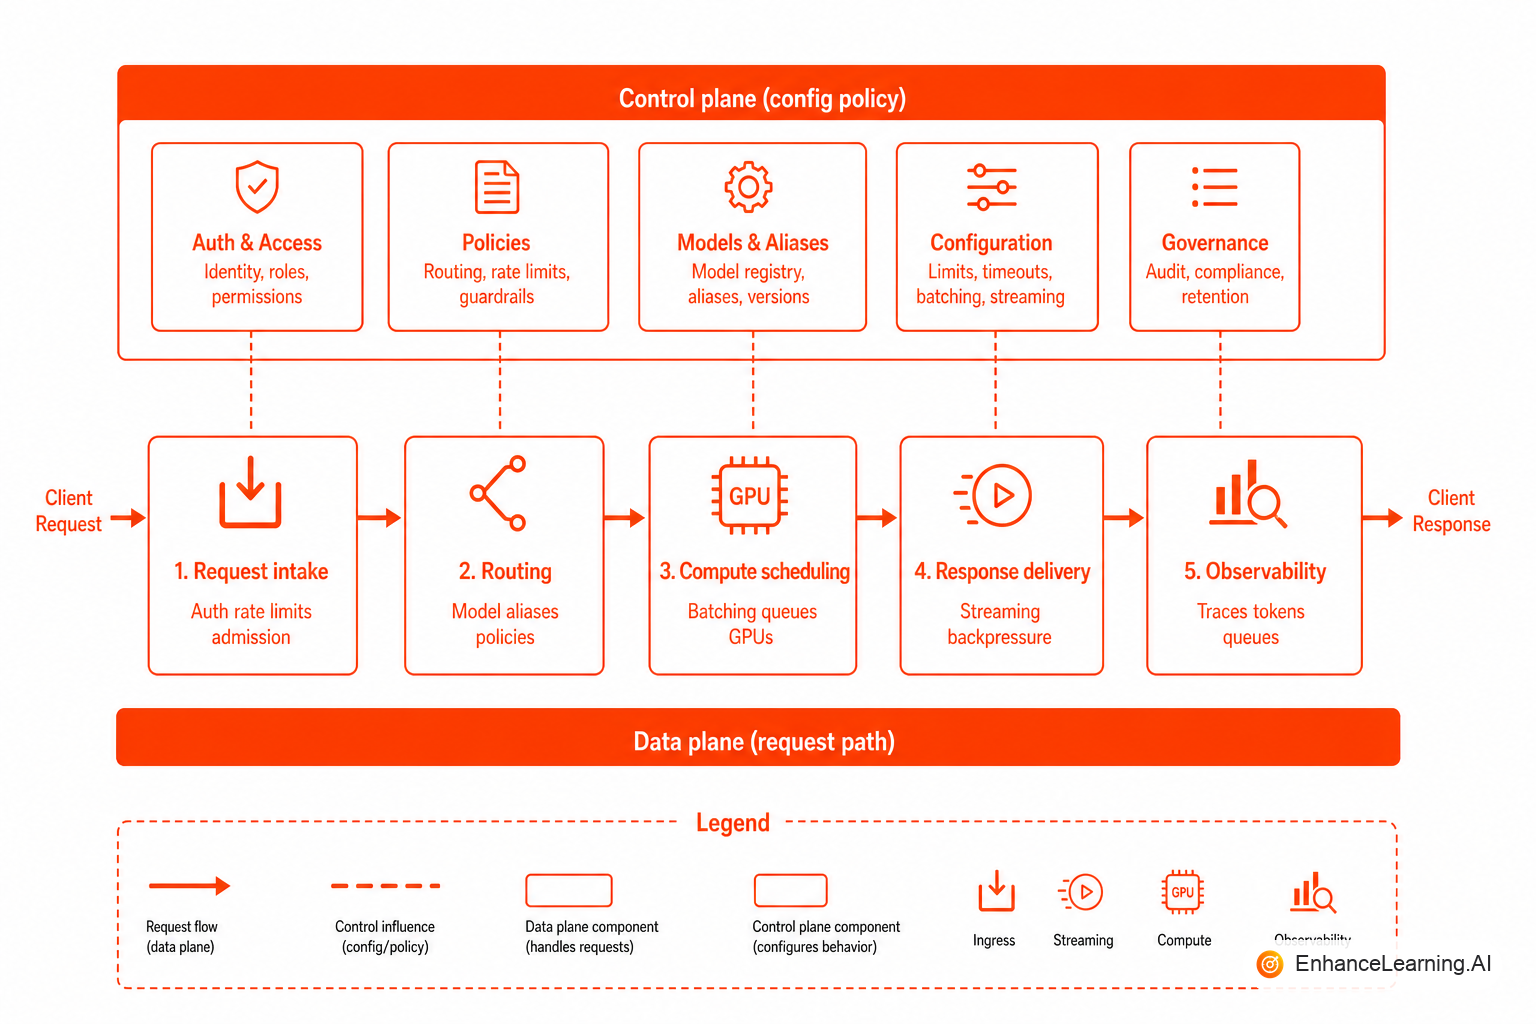
Split the platform into two concerns:
Control plane — configuration, policy, routing rules, alias definitions, spend envelopes, model revision registry, feature flags, and operator dashboards. Changes here are infrequent, audited, and often require approval.
Data plane — the hot path where requests become tokens. Request intake, auth validation, routing decisions, queue management, compute scheduling, streaming delivery, and per-request telemetry emission. Changes here must be safe to deploy without downtime.
Most production incidents happen when control plane config drifts from what the data plane actually executes — an alias pointing to a retired revision, a rate limit that was updated in config but not propagated, a fallback rule that references a decommissioned pool.
Request intake#
Every request enters through a single intake layer — an API gateway, sidecar, or dedicated inference proxy. Intake responsibilities:
- Authenticate the caller (service identity, user context, tenant ID)
- Validate request shape (max tokens, allowed models/aliases, required tags)
- Attach trace context and correlation IDs
- Enforce rate limits at tenant and workflow granularity
- Emit an intake event to telemetry before forwarding
Intake should be fast. Target <50ms overhead. Heavy work — retrieval, tool prep, prompt assembly — belongs upstream in the application layer or in async pre-processing, not in the inference intake path.
import { z } from "zod";
import { trace, context } from "@opentelemetry/api";

const CompleteRequestSchema = z.object({
  alias: z.string().min(1),
  messages: z.array(z.object({
    role: z.enum(["system", "user", "assistant", "tool"]),
    content: z.string(),
  })),
  maxOutputTokens: z.number().int().max(4096).optional(),
  tags: z.record(z.string()).optional(),
  stream: z.boolean().default(false),
});

export async function handleComplete(raw: unknown, auth: AuthContext) {
  const req = CompleteRequestSchema.parse(raw);
  const span = trace.getTracer("inference-platform").startSpan("intake");
  span.setAttributes({
    "ai.alias": req.alias,
    "ai.tenant": auth.tenantId,
    "ai.workflow": req.tags?.workflow ?? "unknown",
  });

  await rateLimiter.check(auth.tenantId, req.alias);
  const resolved = await aliasRegistry.resolve(req.alias);
  return context.with(trace.setSpan(context.active(), span), () =>
    router.dispatch(resolved, req, auth)
  );
}
Reject bad requests at intake. Letting malformed or oversize requests reach compute wastes GPU cycles and pollutes latency metrics.
Routing and policy engine#
The router maps resolved aliases to concrete backends — vendor API endpoints, self-hosted model server pools, or hybrid paths. Routing decisions consider:
| Signal | Routing action |
|---|---|
| Primary pool error rate > threshold | Failover to fallback alias |
| Primary pool queue depth high | Shed to smaller model or queue |
| Spend rate exceeds envelope | Degraded mode or hard reject |
| Request tags match A/B experiment | Route to canary revision |
| Input token count > pool max | Reject or route to long-context pool |
Routing rules live in the control plane and are versioned. The data plane loads them from a config service with watch-based updates — not from redeploying the router binary on every alias change.
Policy evaluation should be deterministic and logged. When a request lands on a fallback model, the trace must show why — error rate, spend cap, operator override, or experiment assignment.
Compute scheduling#
Compute scheduling is where requests meet GPUs or vendor API concurrency limits. For self-hosted pools, the scheduler handles:
- Request queuing with priority classes (interactive > batch)
- Batch formation for continuous batching engines
- Pool selection when multiple GPU pools serve the same alias
- Preemption policy for batch jobs when interactive traffic spikes
For vendor APIs, scheduling means respecting provider rate limits, managing connection pools, and distributing requests across keys or regions without hot-spotting.
import asyncio
from dataclasses import dataclass, field
from collections import deque
import time

@dataclass(order=True)
class QueuedRequest:
    priority: int
    enqueued_at: float = field(compare=False)
    request_id: str = field(compare=False)
    payload: dict = field(compare=False)

class ComputeScheduler:
    def __init__(self, max_concurrent: int, max_queue_depth: int):
        self._semaphore = asyncio.Semaphore(max_concurrent)
        self._queue: deque[QueuedRequest] = deque()
        self._max_queue_depth = max_queue_depth

    async def submit(self, request_id: str, payload: dict, priority: int = 0) -> dict:
        if len(self._queue) >= self._max_queue_depth:
            raise QueueFullError(f"Queue depth {len(self._queue)} exceeds limit")
        item = QueuedRequest(priority=-priority, enqueued_at=time.monotonic(),
                             request_id=request_id, payload=payload)
        self._queue.append(item)
        self._queue = deque(sorted(self._queue))
        async with self._semaphore:
            return await self._execute(item)

    async def _execute(self, item: QueuedRequest) -> dict:
        wait_ms = (time.monotonic() - item.enqueued_at) * 1000
        metrics.record("queue_wait_ms", wait_ms, tags={"priority": str(-item.priority)})
        return await model_server.complete(item.payload)
Queue wait time is the metric that predicts user pain before p95 latency crosses your SLO. Dashboard it per pool and per priority class.
Response delivery#
Delivery handles streaming and non-streaming responses back to the caller:
- Streaming — SSE or WebSocket frames with token chunks, finish reason, and usage metadata in the final frame
- Non-streaming — complete response with token counts and provider request ID for support correlation
- Error mapping — translate provider errors, timeout, and policy rejections into stable error codes the application layer can handle
Delivery must preserve trace context. The final telemetry event — input tokens, output tokens, model revision, latency breakdown, cache hit/miss — attaches to the same trace ID created at intake.
Partial failure in streaming (connection drop mid-response) should be logged as a distinct event, not silently counted as success.
Application retries will happen. Include a client-supplied idempotency key at intake and deduplicate within a short window. Without this, a network blip during streaming becomes a double-charged duplicate completion.
Observability across the platform#
Observability is not a bolt-on — it is a data plane responsibility with control plane visualisation:
Per-request spans — intake → route decision → queue wait → compute → delivery, each with duration and attributes
Aggregated metrics — tokens in/out per alias, error rate by backend, queue depth, cache hit rate, fallback rate, retry multiplier
Quality samples — tagged output samples for offline eval, linked to trace IDs
Cost attribution — dollar or credit estimate per request, rolled up by tenant and workflow
Control plane dashboards expose these aggregates. Data plane components emit them without blocking the hot path — async export to your metrics backend.
Platform components and ownership#
| Component | Control plane | Data plane |
|---|---|---|
| Alias registry | Define, version, approve | Load, resolve |
| Routing rules | Author, test, deploy | Evaluate per request |
| Rate limits | Set per tenant/workflow | Enforce at intake |
| Model server pools | Register, scale, drain | Serve completions |
| Telemetry schema | Define required tags | Emit on every request |
Platform teams own both planes for shared infrastructure. Application teams own tags, workflow definitions, and eval quality targets that inform routing policy.
Deployment and revision management#
Model revisions roll out like any stateful service:
- Register new revision in control plane (disabled)
- Route canary traffic (1–5%) via experiment tags
- Compare latency, cost, and quality samples against baseline
- Promote or rollback based on gates — not on demo feedback
Drain old pools before decommissioning. In-flight requests on a retiring revision should complete or timeout gracefully, not fail mid-stream.
Summary#
A production LLM inference platform is a control plane for policy and configuration plus a data plane for request intake, routing, compute scheduling, and response delivery — all instrumented with token-level observability. Application teams interact through stable aliases and tags. Platform teams operate pools, routing rules, and revision rollouts. Understanding this split is what separates a collection of API calls from infrastructure that survives real traffic, real cost pressure, and real outages.
Want premium architecture blueprints?
Be among the first to explore interactive reference architectures, implementation playbooks, and premium engineering resources at launch.
Related Articles
Recommended reading based on this topic.
Horizontal vs Vertical Scaling for GPU-Backed AI Workloads
When to add GPU nodes versus upgrade existing ones for LLM inference — tradeoffs across model size, traffic patterns, latency targets, and budget.
Read ArticleInference Infrastructure is Where AI Features Survive Production
Reliability, latency, and cost are decided at the inference layer — not by prompts or model choice alone. Why the operational foundation matters most.
Read ArticleThe AI Inference Stack Explained
A clear map of the AI inference stack: gateways, model serving, caching, embeddings, queues, and observability — and what to own versus buy at each layer.
Read Article