
Why AI Infrastructure Needs Token-Level Observability
Request counts miss what drives AI cost and latency. Token-level observability — volume, routing, queue metrics — is the day-one baseline for inference infra.
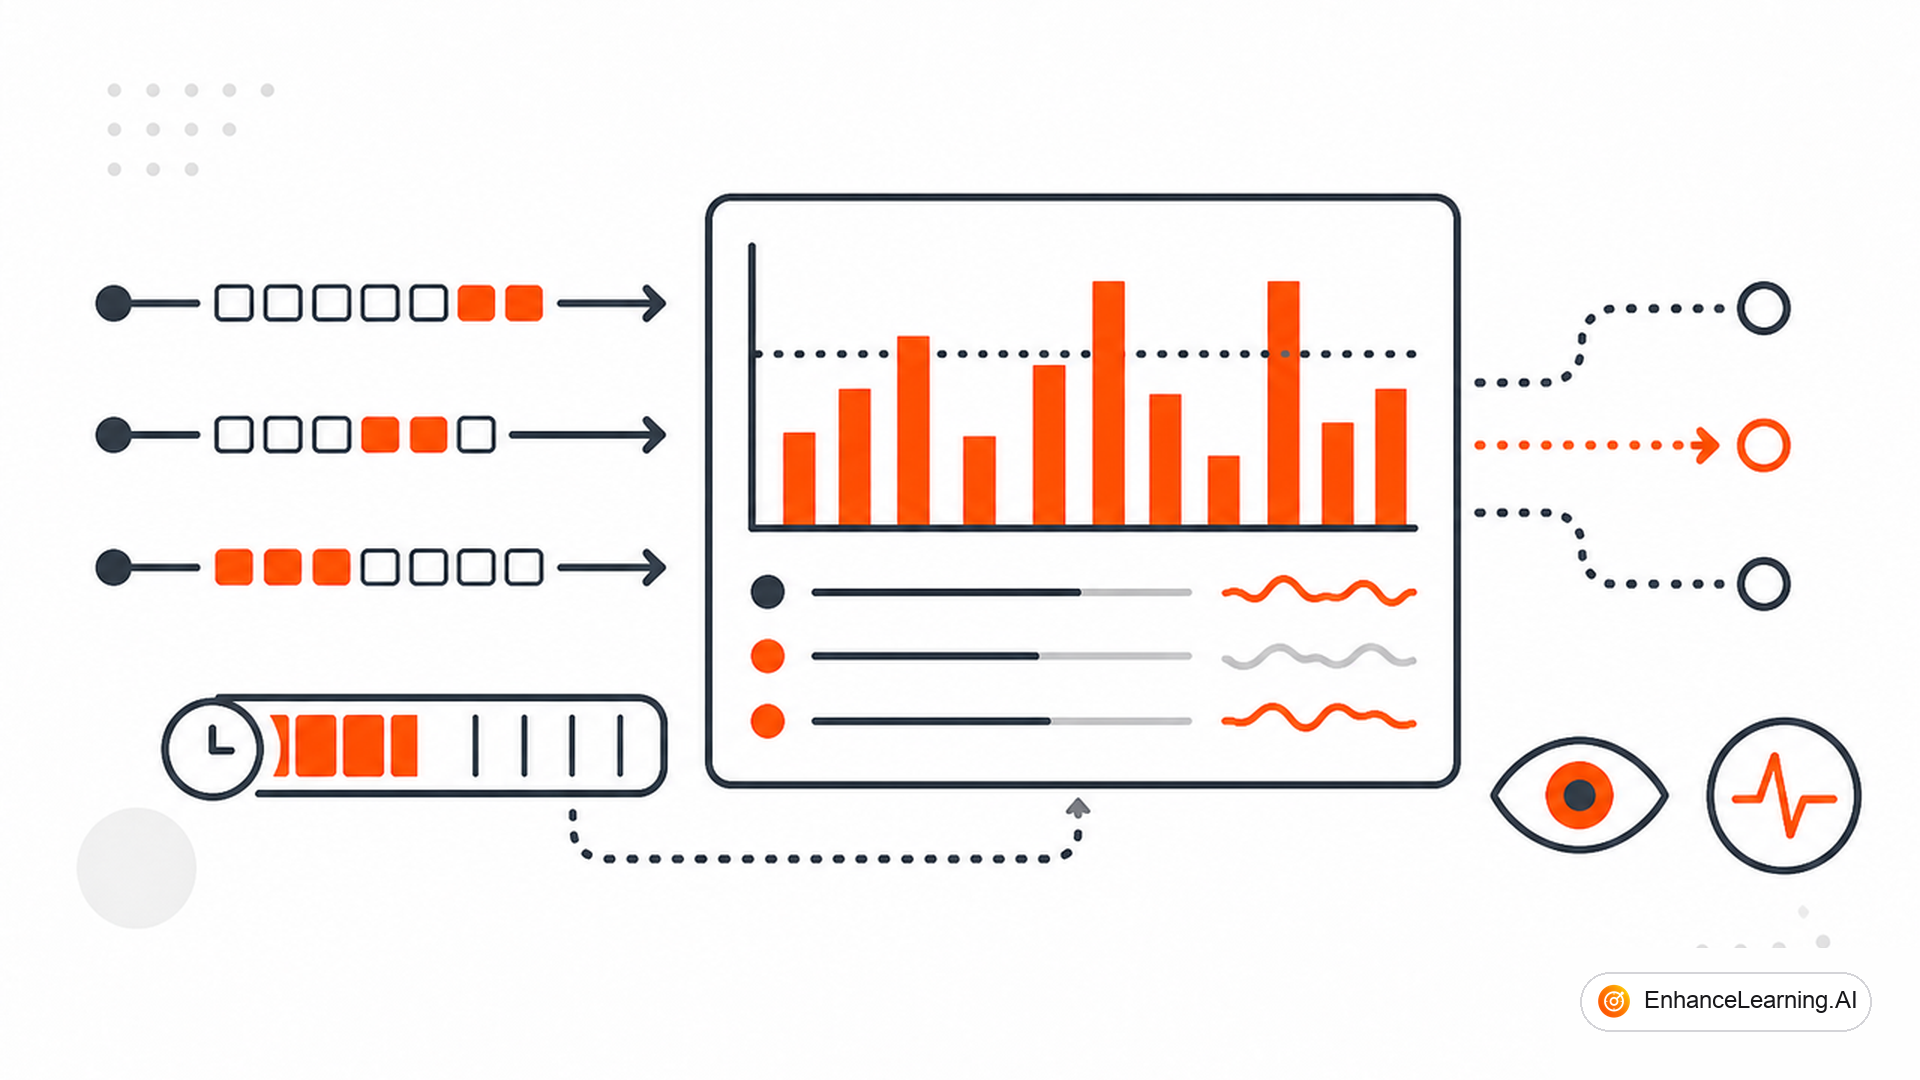
Your inference dashboard shows 10,000 requests per hour and 99.2% success rate. Finance still asks why spend doubled. Product still reports that "the AI got slower." Request-level metrics answered the wrong questions — they counted calls without measuring tokens, routing decisions, or time spent waiting in queue. AI infrastructure needs token-level observability from day one, not after the first invoice surprise.
Why request counts lie#
A "request" in AI systems is not a unit of work the way an HTTP request is in a CRUD API. One user action can spawn:
- An embedding call (small token count, fast)
- A retrieval-augmented completion (large input, moderate output)
- A critique pass (duplicate context plus new output)
- Two tool-round-trip completions when the first tool result requires reinterpretation
Ten requests per minute at 500 tokens each is a different infrastructure load than ten requests at 8,000 tokens each. Autoscaling on request count alone scales too late. Cost allocation on request count alone blames the wrong team.
| Metric | What it tells you | What it hides |
|---|---|---|
| Request count | Call volume | Tokens per call, retry multiplier |
| Error rate | Failures | Partial streams, degraded quality |
| p95 latency | User pain (aggregate) | Queue wait vs generation vs tools |
| Success rate | Completion | Cost of succeeded requests |
Token-level metrics restore the signal request counts flatten.
The minimum viable telemetry schema#
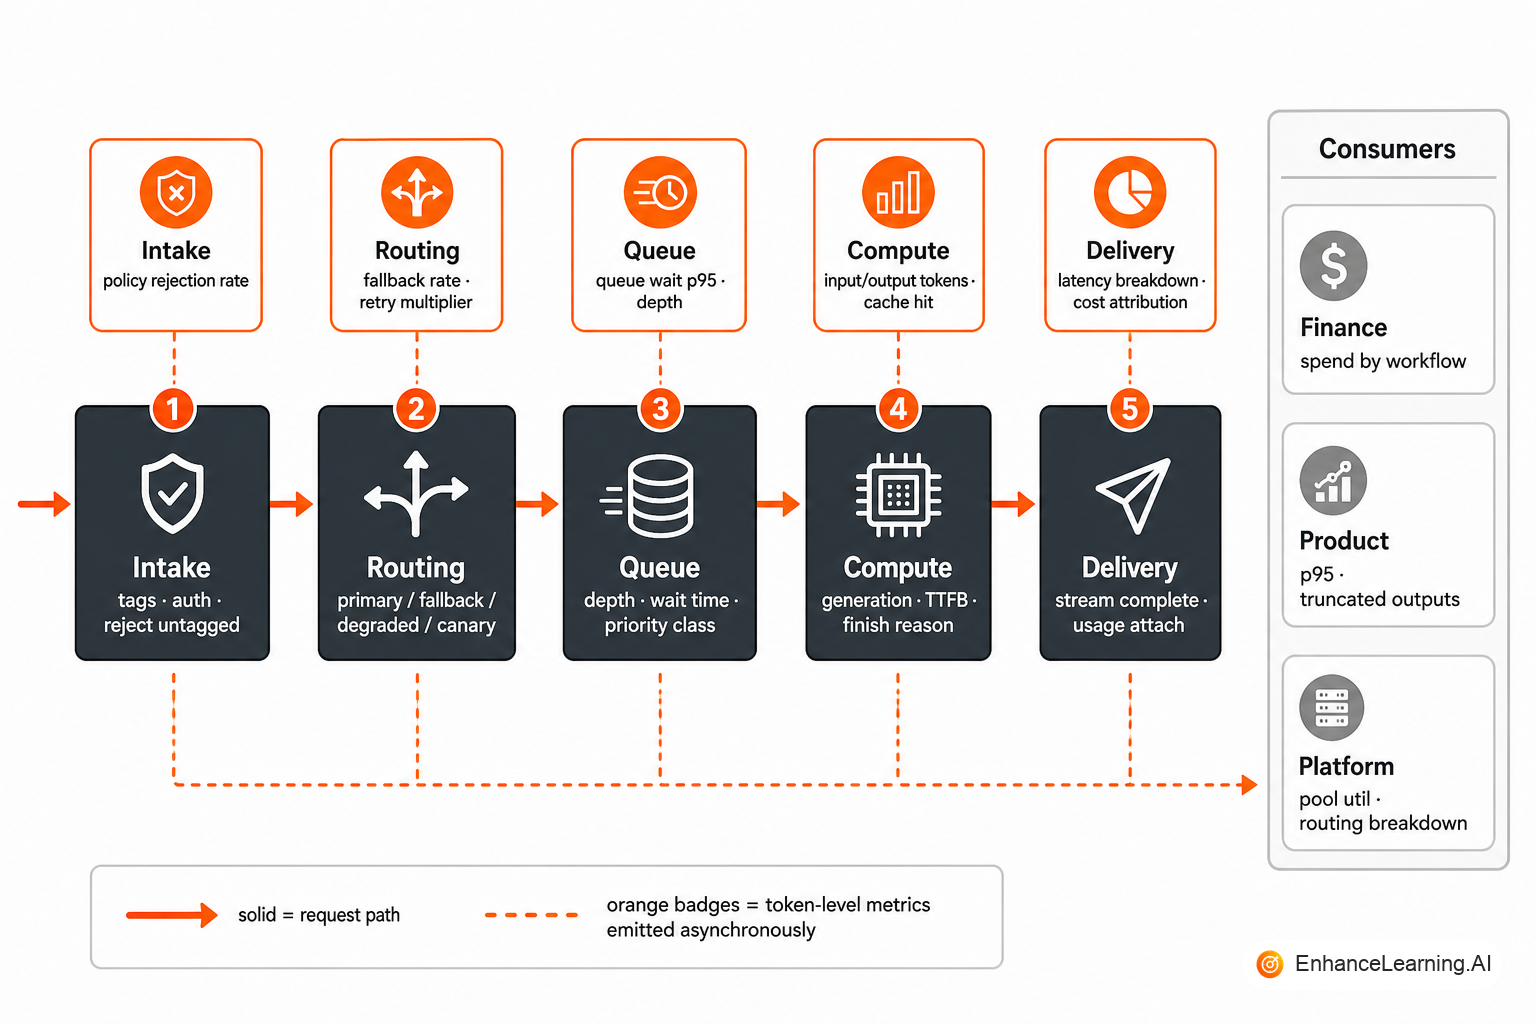
Every inference request should emit a structured event — or OpenTelemetry span — with at least:
input_tokensandoutput_tokens(from provider response or local tokenizer)modeloraliasandmodel_revisiontenant_id,workflow,environmenttagslatency_msbroken down: intake, queue_wait, provider_ttfb, generation, deliveryrouting_decision— primary, fallback, degraded, experiment canarycache_hit— none, prefix, semanticretry_attempt— 0 for first try, 1+ for retriesprovider_request_idfor vendor support correlationfinish_reason— stop, length, error, timeout
from dataclasses import dataclass, asdict
from opentelemetry import trace
import json
import time

tracer = trace.get_tracer("inference-telemetry")

@dataclass
class InferenceEvent:
    trace_id: str
    alias: str
    model_revision: str
    input_tokens: int
    output_tokens: int
    queue_wait_ms: float
    provider_ttfb_ms: float
    generation_ms: float
    routing_decision: str
    cache_hit: str
    retry_attempt: int
    tenant_id: str
    workflow: str

def emit_inference_event(event: InferenceEvent) -> None:
    span = trace.get_current_span()
    span.set_attributes({f"ai.{k}": v for k, v in asdict(event).items()
                         if isinstance(v, (int, float, str))})
    # Async export to metrics backend — never block the response path
    metrics_sink.enqueue(json.dumps(asdict(event)))

def record_completion(alias: str, usage: dict, timings: dict, meta: dict) -> None:
    with tracer.start_as_current_span("inference.complete") as span:
        event = InferenceEvent(
            trace_id=format(span.get_span_context().trace_id, "032x"),
            alias=alias,
            model_revision=meta["revision"],
            input_tokens=usage["prompt_tokens"],
            output_tokens=usage["completion_tokens"],
            queue_wait_ms=timings["queue_wait_ms"],
            provider_ttfb_ms=timings["ttfb_ms"],
            generation_ms=timings["generation_ms"],
            routing_decision=meta["routing"],
            cache_hit=meta.get("cache_hit", "none"),
            retry_attempt=meta.get("retry_attempt", 0),
            tenant_id=meta["tenant_id"],
            workflow=meta["workflow"],
        )
        emit_inference_event(event)
Emit asynchronously. Telemetry that blocks the hot path becomes the next bottleneck.
Ship token counts, alias, workflow tag, and queue wait time before you ship fancy dashboards. Four fields, aggregated hourly, prevent more cost surprises than a full APM suite deployed six months late.
Token volume metrics that matter#
Tokens in / tokens out per alias — the actual cost driver. Roll up by hour, day, and workflow. Compare week-over-week, not only absolute totals.
Tokens per successful task — divide total tokens by completed user tasks (not provider calls). A workflow that requires 1.4 completions per task carries a 40% hidden token tax.
Context size percentiles — p50, p95, p99 input tokens. p95 input tokens predict cost cliffs before finance sees them. Alert when p95 grows 20% week-over-week without a known product change.
Output token distribution — spikes in finish_reason: length mean users are getting truncated answers. That is a product quality issue visible only in token telemetry.
Routing and policy metrics#
Routing decisions should be first-class metrics, not log archaeology:
- Fallback rate — percentage of requests hitting fallback alias. Sustained elevation means primary pool trouble or overly aggressive error thresholds.
- Degraded mode rate — how often spend caps or load shedding activate. Product teams need this visible, not buried in platform logs.
- Canary traffic share — confirm experiment routing matches control plane intent.
- Policy rejection rate — requests blocked at intake for token limits, auth, or budget. High rejection rate on one workflow means application code is misconfigured, not that the model failed.
| Alert | Threshold (starting point) | Action |
|---|---|---|
| Fallback rate | >5% for 10 min | Check primary pool health |
| Retry multiplier | >1.3 rolling hourly | Review gateway retry policy |
| p95 input tokens | +20% WoW | Audit context assembly |
| Queue wait p95 | >300ms | Scale pool or shed load |
| Cache hit rate | <10% after 7 days | Revisit cache key/TTL design |
Tune thresholds per workflow. Support chat and batch extraction have different baselines.
Queue metrics bridge infra and product#
Queue wait time is the earliest signal that compute capacity is insufficient. It appears in latency before error rates move, and it is invisible to application-level HTTP metrics if the app waits synchronously on a single endpoint.
Track:
- Queue depth per pool and priority class
- Time in queue p50/p95/p99
- Rejection rate when queue exceeds max depth
- Scheduler dispatch rate vs incoming request rate
Product teams experience queue wait as "the AI is slow." Without queue metrics, platform teams argue about provider latency while the real problem is underscaled replicas.
Joining traces across the stack#
Token metrics in isolation explain cost. Joined to application traces, they explain behaviour.
The trace chain should link: user action span → orchestration span → gateway intake span → provider span → tool spans. Each hop carries the same workflow and tenant tags. When a user complains about a bad answer, you reconstruct the full token budget — input assembly, retrieval, completion, critique — in one trace view.
Provider request IDs must flow back to the application. Vendor support tickets without them waste days.
Dashboards finance and product will actually use#
Platform dashboards serve operators. Also publish simplified views:
For finance — spend by workflow, tokens in/out trend, cost per successful task, retry tax as a line item.
For product — latency p95 by workflow, fallback rate, truncated output rate (finish_reason: length), degraded mode activations.
For platform — queue depth, pool utilisation, error rate by backend, cache hit rate, routing decision breakdown.
If product and finance cannot self-serve these views, they will ask you in Slack every week — and you will answer with manual queries instead of building features.
Sampling and retention without losing signal#
Full output logging for every request is expensive and often non-compliant. Sample intelligently:
- 100% token metrics (numbers, not text) — always
- 1–5% full trace with redacted prompt/response for quality review
- 100% capture for error and fallback events
- Retention aligned with legal policy — token counts longer than raw text
Aggregates survive longer than samples. Your cost trend analysis needs hourly token totals for a year, not every prompt stored forever.
Anti-patterns that waste the telemetry investment#
- Logging tokens in unstructured text — cannot aggregate; grep is not a metrics backend
- Missing workflow tags — all spend appears as "unknown" and nobody optimises
- Retry spans not linked to parent — retry multiplier looks like organic traffic growth
- Dashboards without alerts — pretty graphs that nobody watches at 2 a.m.
- Quality samples disconnected from token metrics — you see cost went up but not that output quality went down on the same alias
Fix the schema before you fix the dashboard tooling. Bad data at scale is worse than no data.
Summary#
AI infrastructure needs token-level observability because request counts do not capture what drives cost, latency, or capacity needs in LLM systems. Measure input and output tokens, routing decisions, queue wait time, retry attempts, and cache hits on every inference call — tagged by workflow and tenant. Aggregate for finance and product dashboards; alert on fallback rate, context size drift, and queue depth. Build the telemetry schema on day one at the gateway, not after the first spend surprise. The teams that operate inference reliably treat tokens as a first-class metric — the same way mature platforms treat bytes on the wire.
Want premium architecture blueprints?
Be among the first to explore interactive reference architectures, implementation playbooks, and premium engineering resources at launch.
Related Articles
Recommended reading based on this topic.
Horizontal vs Vertical Scaling for GPU-Backed AI Workloads
When to add GPU nodes versus upgrade existing ones for LLM inference — tradeoffs across model size, traffic patterns, latency targets, and budget.
Read ArticleThe Architecture of a Production LLM Inference Platform
Production LLM inference as control and data planes: intake, routing, compute scheduling, response delivery, and observability — a platform mental model.
Read ArticleHow to Evaluate AI Systems in Production
A practical eval stack for production AI: golden sets, trajectory checks, LLM-as-judge pitfalls, online sampling, and regression gates that block bad releases.
Read Article